
Stellar Populations of the EDisCS Cluster/Group/Field Galaxy Sample
This paper we are working on with Prof. Greg Rudnick focuses on the determination and analysis of the stellar population content of ESO Distant Cluster Survey (EDisCS) galaxies.
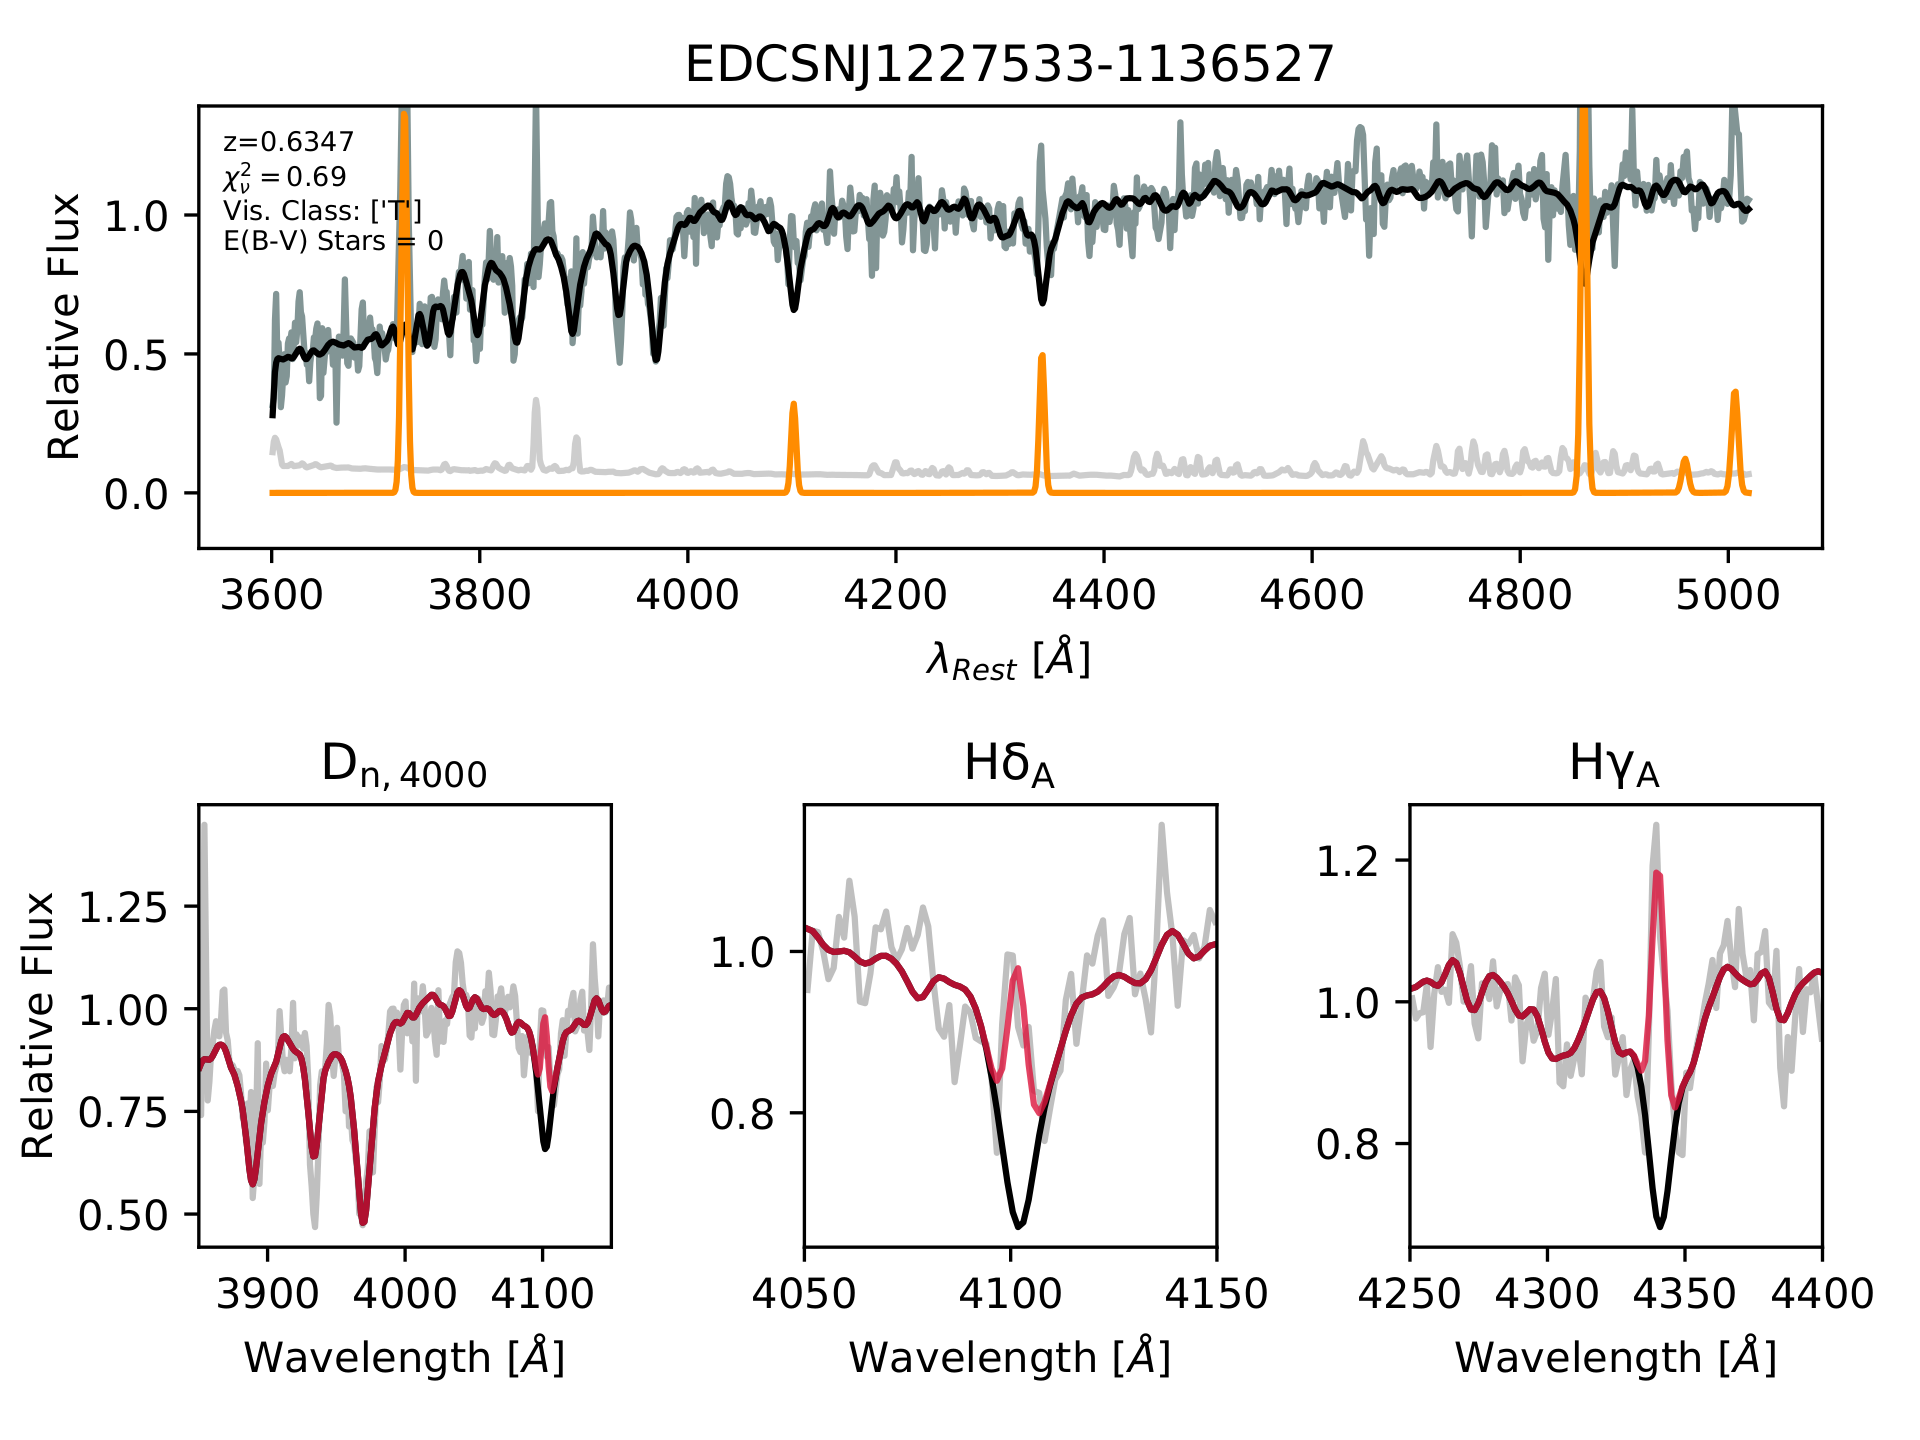
The figure above is compiled following the full-spectrum pPXF fitting we performed. The observed rest-frame spectrum of the galaxy is shown in gray in the top panel of the figure, and the corresponding error as light gray towards the bottom of the panel. Overplotted on it is the best-fitting stellar component shown in black. The orange curves represent fits to the prominent emission features in the wavelength range. We display other important features in this range as separate panels at the bottom row of the figure. From left to right are the narrow definition of the 4000 Angstrom break Dn4000 (Balogh et al. 1999), the Hdelta absorption line, and the Hgamma absorption line. The red line in the bottom panels is the sum of the stellar and gas emission components.